
open your js console
Month: April 2019
LI school budgets in three cost categories
Under state law, each public school district’s Board of Education must notify residents, before the May budget vote, of proposed expenditures for the coming year in three categories –– administrative, program and capital. Below are percentage breakdowns in each category, compiled by Newsday education researcher Michael R. Ebert, for Long Island’s 124 school districts for the 2018-19 school year, with district budget totals alongside their names.
Administrative includes salaries and benefits of superintendents, principals and other administrators, as well as business operations of the district and the school board. The Long Island average is 10 percent. Program includes funds spent on teaching, student programs and services, extracurricular activities and bus transportation, excluding vehicle purchases. The Long Island average is 77 percent. Capital encompasses money spent on buildings and other physical property and debt service. The Long Island average is 13 percent.
Click on a district name to view detailed tables comparing data with Islandwide statistics and showing annual figures since 2010-11 for administrative, program and capital costs as budgeted before spring elections. Tables for per-pupil spending, special education costs and enrollment are included. In coming days, districts must send residents the state-mandated “three-component” budget notices for the 2019-20 school year. This database was updated on April 25, 2019.
Administrative
Program
Capital
Stuff goes here
Enrollment figures provided by the New York State Education Department. Projected enrollment figures, the latest available, were used for the 2018-2019 school year.
Population estimates for Nassau and Suffolk
Suffolk County experienced a fifth year of population loss in 2018, down 2,478 residents to 1,481,093, while Nassau continued to rise, up 679 to 1,358,343, according to the latest annual estimates from the Census Bureau. Here are details on the population shift for each county.
The overall population — Nassau is up and Suffolk is down
Click through on the right for these seven charts; select bars or data points for details.
Details in the table below, and you can read more about Long Island’s population trends here.
The details on these and other measures
Figures from the charts, with additional measures. Rates are per 1,000 residents.
| Category/Year | Nassau County | Suffolk County |
|---|---|---|
| Population estimate 2011 | 1,346,176 | 1,498,838 |
| Population estimate 2012 | 1,349,723 | 1,497,037 |
| Population estimate 2013 | 1,352,399 | 1,497,489 |
| Population estimate 2014 | 1,355,029 | 1,495,757 |
| Population estimate 2015 | 1,355,319 | 1,492,278 |
| Population estimate 2016 | 1,356,463 | 1,486,804 |
| Population estimate 2017 | 1,357,664 | 1,483,571 |
| Population estimate 2018 | 1,358,343 | 1,481,093 |
| Net population change 2011 | 4,489 | 4,453 |
| Net population change 2012 | 3,547 | -1,801 |
| Net population change 2013 | 2,676 | 452 |
| Net population change 2014 | 2,630 | -1,732 |
| Net population change 2015 | 290 | -3,479 |
| Net population change 2016 | 1,144 | -5,474 |
| Net population change 2017 | 1,201 | -3,233 |
| Net population change 2018 | 679 | -2,478 |
| Births 2011 | 14,304 | 16,465 |
| Births 2012 | 14,170 | 16,057 |
| Births 2013 | 13,781 | 15,617 |
| Births 2014 | 14,232 | 15,554 |
| Births 2015 | 14,318 | 15,819 |
| Births 2016 | 14,366 | 15,776 |
| Births 2017 | 14,318 | 15,461 |
| Births 2018 | 14,117 | 15,210 |
| Deaths 2011 | 10,903 | 11,572 |
| Deaths 2012 | 10,743 | 11,464 |
| Deaths 2013 | 11,399 | 11,947 |
| Deaths 2014 | 10,548 | 11,571 |
| Deaths 2015 | 11,024 | 11,770 |
| Deaths 2016 | 10,856 | 11,793 |
| Deaths 2017 | 11,215 | 12,731 |
| Deaths 2018 | 11,419 | 13,061 |
| International migration 2011 | 3,087 | 3,487 |
| International migration 2012 | 3,365 | 3,393 |
| International migration 2013 | 3,001 | 2,863 |
| International migration 2014 | 3,171 | 2,962 |
| International migration 2015 | 3,221 | 2,961 |
| International migration 2016 | 3,353 | 3,121 |
| International migration 2017 | 2,497 | 2,327 |
| International migration 2018 | 2,478 | 2,367 |
| Domestic migration 2011 | -1,890 | -3,855 |
| Domestic migration 2012 | -3,143 | -9,874 |
| Domestic migration 2013 | -2,609 | -6,023 |
| Domestic migration 2014 | -4,136 | -8,682 |
| Domestic migration 2015 | -6,181 | -10,508 |
| Domestic migration 2016 | -5,701 | -12,599 |
| Domestic migration 2017 | -4,366 | -8,297 |
| Domestic migration 2018 | -4,476 | -7,004 |
| Net migration 2011 | 1,197 | -368 |
| Net migration 2012 | 222 | -6,481 |
| Net migration 2013 | 392 | -3,160 |
| Net migration 2014 | -965 | -5,720 |
| Net migration 2015 | -2,960 | -7,547 |
| Net migration 2016 | -2,348 | -9,478 |
| Net migration 2017 | -1,869 | -5,970 |
| Net migration 2018 | -1,998 | -4,637 |
| Birth rate 2011 | 10.64339961 | 11.0015191 |
| Birth rate 2012 | 10.51226326 | 10.71940585 |
| Birth rate 2013 | 10.2001316 | 10.43036527 |
| Birth rate 2014 | 10.51329897 | 10.39273084 |
| Birth rate 2015 | 10.56543293 | 10.58822939 |
| Birth rate 2016 | 10.59524696 | 10.59118212 |
| Birth rate 2017 | 10.5507222 | 10.4101334 |
| Birth rate 2018 | 10.39540767 | 10.26085924 |
| Death rate 2011 | 8.112764676 | 7.732133556 |
| Death rate 2012 | 7.969883145 | 7.653189803 |
| Death rate 2013 | 8.43707279 | 7.979226095 |
| Death rate 2014 | 7.791896959 | 7.731405972 |
| Death rate 2015 | 8.134748748 | 7.878087104 |
| Death rate 2016 | 8.006543299 | 7.917204025 |
| Death rate 2017 | 8.264167447 | 8.571981652 |
| Death rate 2018 | 8.408667577 | 8.811116538 |
| International migration rate 2011 | 2.296992071 | 2.329929979 |
| International migration rate 2012 | 2.496384323 | 2.265114533 |
| International migration rate 2013 | 2.221217251 | 1.912155714 |
| International migration rate 2014 | 2.342444564 | 1.979122331 |
| International migration rate 2015 | 2.376816556 | 1.981904496 |
| International migration rate 2016 | 2.472912646 | 2.09527633 |
| International migration rate 2017 | 1.840002329 | 1.566805538 |
| International migration rate 2018 | 1.824737565 | 1.596808272 |
| Domestic migration rate 2011 | -1.406321676 | -2.575818775 |
| Domestic migration rate 2012 | -2.331689726 | -6.591730296 |
| Domestic migration rate 2013 | -1.931074911 | -4.022673371 |
| Domestic migration rate 2014 | -3.055298239 | -5.80106012 |
| Domestic migration rate 2015 | -4.561037918 | -7.033384816 |
| Domestic migration rate 2016 | -4.204615268 | -8.458310312 |
| Domestic migration rate 2017 | -3.217240755 | -5.586500021 |
| Domestic migration rate 2018 | -3.296015069 | -4.724987385 |
| Net migration rate 2011 | 0.890670395 | -0.245888796 |
| Net migration rate 2012 | 0.164694597 | -4.326615763 |
| Net migration rate 2013 | 0.29014234 | -2.110517658 |
| Net migration rate 2014 | -0.712853675 | -3.821937789 |
| Net migration rate 2015 | -2.184221362 | -5.051480321 |
| Net migration rate 2016 | -1.731702622 | -6.363033982 |
| Net migration rate 2017 | -1.377238427 | -4.019694483 |
| Net migration rate 2018 | -1.471277504 | -3.128179112 |
Joye test before/after
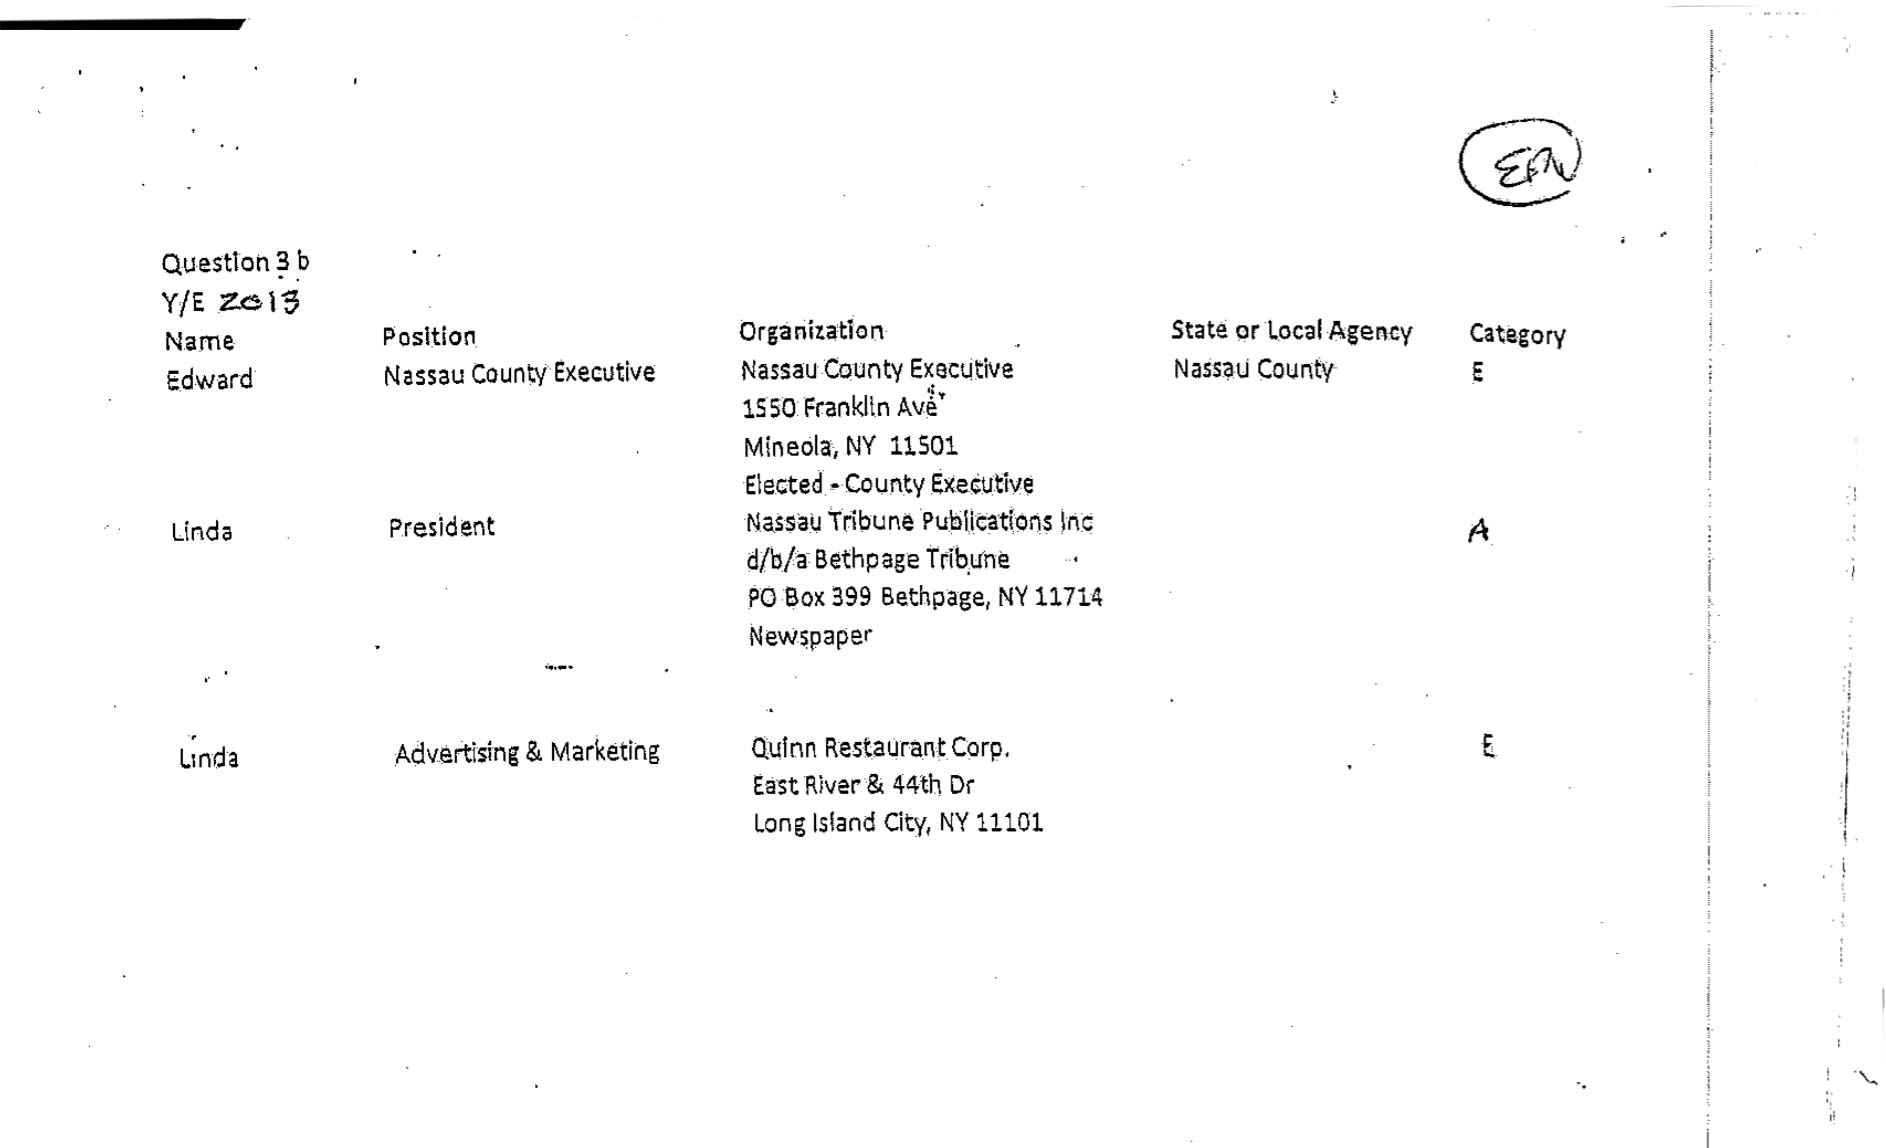
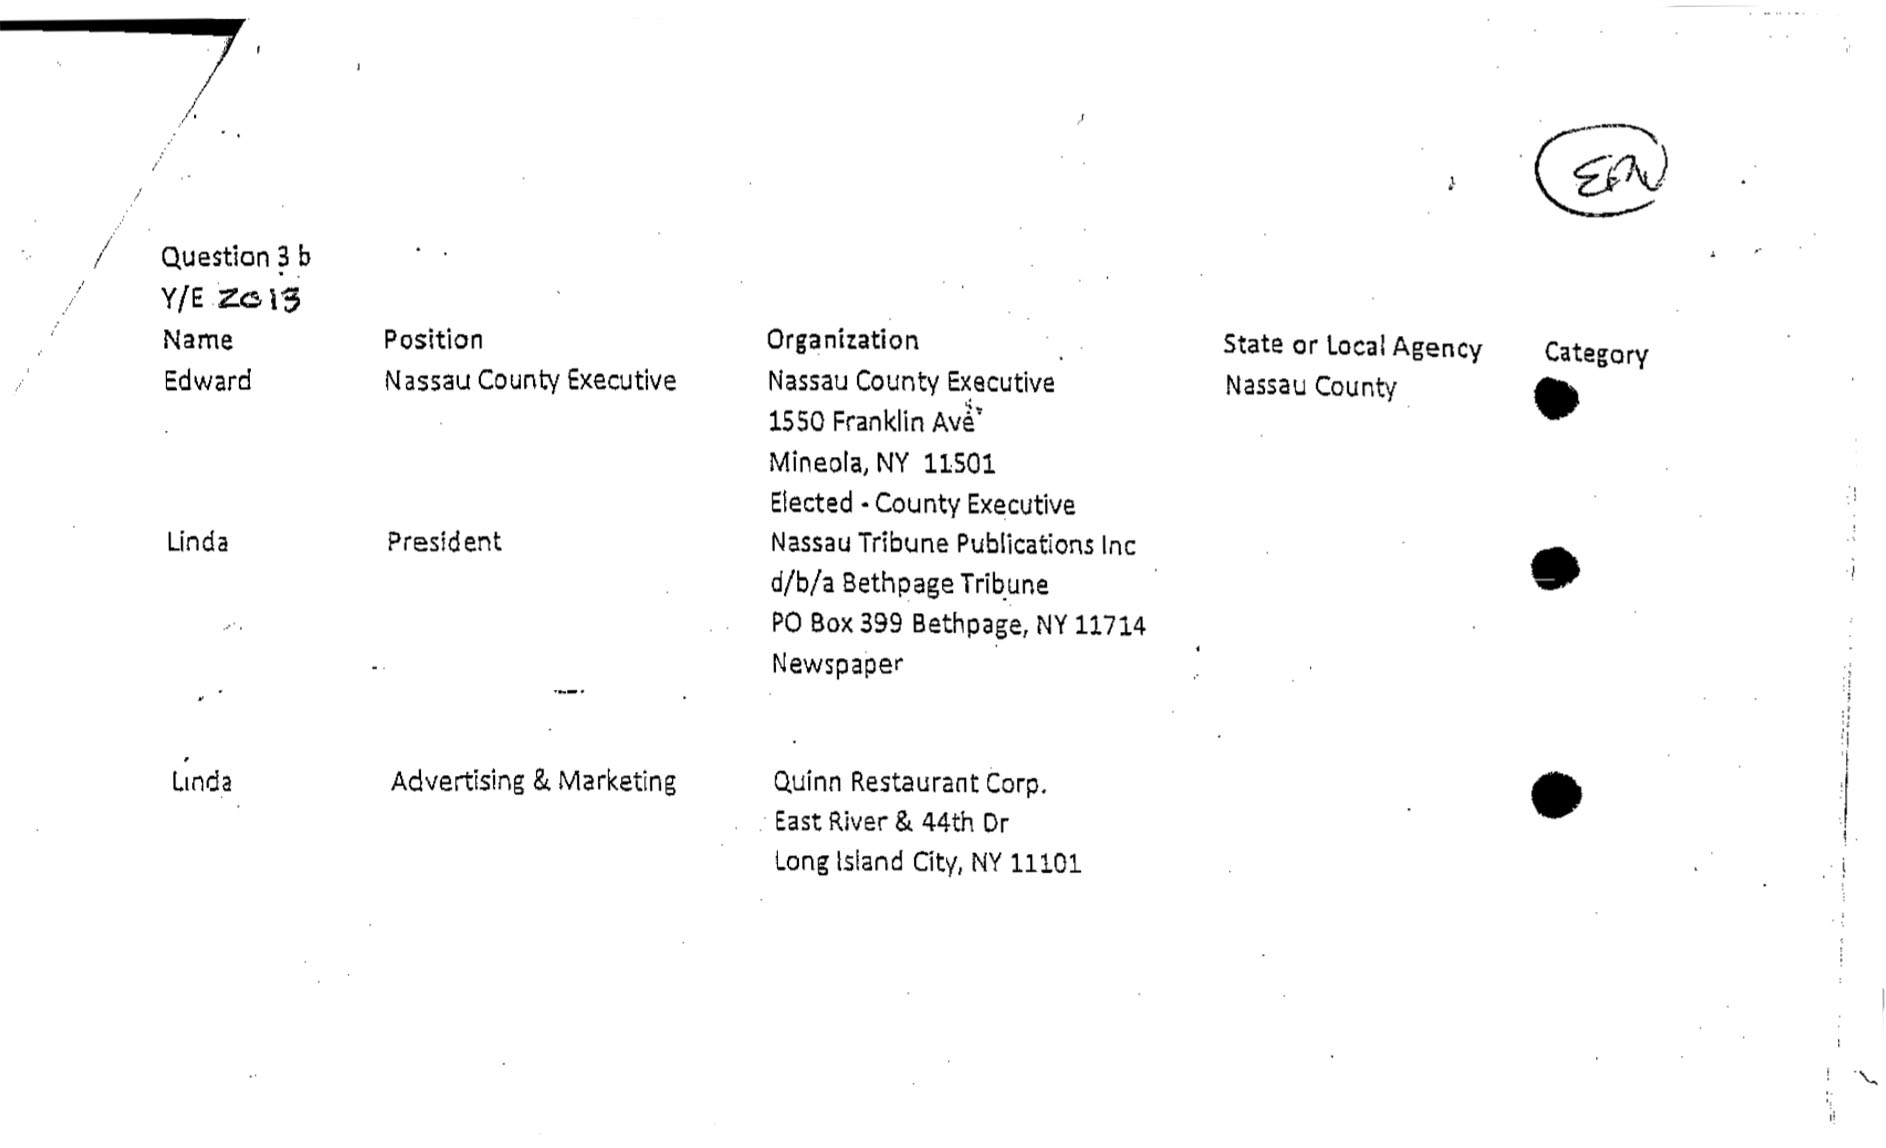
One of the last items entered into evidence during the retrial of Edward Mangano on federal corruption-related charges was a series of financial disclosure forms the former county executive filed with Nassau’s ethics board.
Kevin Keating, Mangano’s defense attorney, made much of one disclosure Mangano made in the forms — a no-show job for his wife, Linda, which had come her way courtesy of restaurateur Harenda Singh, the couple’s former friend.
The prosecution, however, zeroed in on what Mangano did not disclose — including two expensive chairs, vacations, meals and the purchase and installation of wood flooring for the Mangano’s bedroom — all paid for by Singh as well.
“These forms are devastating evidence proving Mangano’s corrupt intent,” Asst. U.S. Attorney Christopher Caffarone told jurors, who would go on, days later, to convict the couple. “…He’s not listing bribes on these forms or he would have wound up in that chair a lot earlier,” the prosecutor went on, pointing toward the defense table.
Even after the trial, government, Mangano’s disclosure forms — Exhibits #445 through #450 — remain relevant.
Over the past few weeks, the issues of both disclosure and Nassau’s ethics board have been the subject of two news conferences — by Laura Curran, Nassau’s county executive, and Jack Schnirman, the county’s comptroller.
Jan. 27, 2015; Photo credit: AP / Sept. 20, 2017; Photo credit: Jeff Bachner
Curran, standing on the steps of the historic courthouse that houses Nassau’s executive and legislative branches, announced creation of an application that would allow 700 county employees — designated as “policy makers” — to file required financial disclosure forms via computer, rather than, as Mangano and others in the past have done, on paper.
Rather than having forms that often, as Curran said, ended up being “hidden away in a basement,” the new database could, for the first time, tie into Nassau’s contract and vendor contracting systems as a way for the ethics board to spot potential conflicts of interest.
One caveat, however: The database will not be open to perusal by the public — although the ability to request redacted versions of forms for individuals remain an option, through the state’s Freedom of Information law. (By contrast, disclosure forms filed to New York State are available — in unredacted form — online.)
Schnirman, standing outside the same courthouse two weeks later, would speak about a 134-page report (which I read, so you wouldn’t have to) his office issued on Nassau’s ethics board — which includes his office’s request, and the board attorney’s refusal, to grant auditors access to disclosure forms.
Curran has appointed new board members, Schnirman noted, who appear to be moving towards making board operations more transparent, and hte board itself more active.
Under Mangano, however, the comptroller’s report said, the independent board of ethics “failed its mission” in a variety of ways, including being inactive at a time when federal officials were investigating political corruption in Nassau.
One result of those investigations was the indictment of Mangano, and in March, his conviction on corruption-related charges, after a retrial. He and Linda Mangano, who was convicted of conspiracy and lying to FBI agents, are slated to be sentenced in October.
Before sentencing, however, Mangano, will be required to pay $526,606 under a forfeiture order signed earlier this month by U.S. District Court Judge Joan M. Azrack.
The payment covers one item Mangano disclosed in his forms: a total $450,000 Linda Mangano received from Singh between 2010 and 2014, while Mangano was Nassau’s top elected official.
But the forfeiture order also items from Singh that Mangano’s forms did not include: a massage chair worth $3,623.73, an office chair worth $3,371.90, free meals at Singh’s restaurant worth $42,000, airfare and hotel expenses worth $19,227.32 and hardwood floors worth $4,105.
Mangano also forfeited a watch Singh bought for Mangano’s son, for which the former restaurant owner paid.$7,304.
That, as the prosecution pointed out, wasn’t on Mangano’s financial disclosure forms either.
The Conversation pixel test
AC HP MARKUP
Top Stories
-
 Article Title 1 Goes Here
Lorem ipsum dolor sit amet, consectetur adipiscing elit, sed do eiusmod tempor incididunt ut labore et dolore magna aliqua
-
Article 2 Title Goes Here
Lorem ipsum dolor sit amet, consectetur adipiscing elit, sed do eiusmod tempor incididunt ut labore et dolore magna aliqua
-
Article 3 Title Goes Here
Lorem ipsum dolor sit amet, consectetur adipiscing elit, sed do eiusmod tempor incididunt ut labore et dolore magna aliqua
-
Article 4 Title Goes Here
Lorem ipsum dolor sit amet, consectetur adipiscing elit, sed do eiusmod tempor incididunt ut labore et dolore magna aliqua
// LEADER AD –
TODAYS PAPER LINK
Editors Pick
-
Editors pick 1 Goes Here
Lorem ipsum dolor sit amet, consectetur adipiscing elit, sed do eiusmod tempor incididunt ut labore et dolore magna aliqua
-
Editors pick 2 Goes Here
Lorem ipsum dolor sit amet, consectetur adipiscing elit, sed do eiusmod tempor incididunt ut labore et dolore magna aliqua
-
Editors pick 3 Goes Here
Lorem ipsum dolor sit amet, consectetur adipiscing elit, sed do eiusmod tempor incididunt ut labore et dolore magna aliqua
-
NATIVO Goes Here
Lorem ipsum dolor sit amet, consectetur adipiscing elit, sed do eiusmod tempor incididunt ut labore et dolore magna aliqua
Long Island/Local?
-
Local title 1 Goes Here
Lorem ipsum dolor sit amet, consectetur adipiscing elit, sed do eiusmod tempor incididunt ut labore et dolore magna aliqua
-
Local title 2 Goes Here
Lorem ipsum dolor sit amet, consectetur adipiscing elit, sed do eiusmod tempor incididunt ut labore et dolore magna aliqua
-
Local title 3 Goes Here
Lorem ipsum dolor sit amet, consectetur adipiscing elit, sed do eiusmod tempor incididunt ut labore et dolore magna aliqua
-
Local title 4 Goes Here
Lorem ipsum dolor sit amet, consectetur adipiscing elit, sed do eiusmod tempor incididunt ut labore et dolore magna aliqua
-
Local title 5 Goes Here
Lorem ipsum dolor sit amet, consectetur adipiscing elit, sed do eiusmod tempor incididunt ut labore et dolore magna aliqua
Opinion
-
Opinion 1 Goes Here
Lorem ipsum dolor sit amet, consectetur adipiscing elit, sed do eiusmod tempor incididunt ut labore et dolore magna aliqua
-
Opinion 2 Goes Here
Lorem ipsum dolor sit amet, consectetur adipiscing elit, sed do eiusmod tempor incididunt ut labore et dolore magna aliqua
-
Opinion 3 Goes Here
Lorem ipsum dolor sit amet, consectetur adipiscing elit, sed do eiusmod tempor incididunt ut labore et dolore magna aliqua
CUBE AD STICKY
Subscription Offer [A/B Test]
Subscription Packages
Choose a plan that’s right for you. Upgrade or cancel anytime.
Digital Access
for 4 weeks
$3.49/week thereafter Billed every 4 weeks
- Unlimited access to newsday.com
- Full access to all of our Newsday apps
- Access to our E-Edition newspaper
- Access to Newsday original content (FeedMe TV, Newsday Live, etc…)
Sunday Delivery + Digital Access
for 8 weeks
$1.99/week thereafter Billed every 8 weeks
- The Sunday Newsday print edition, delivered weekly
- Unlimited access to newsday.com
- Full access to all of our Newsday apps
- Access to our E-Edition newspaper
- Access to Newsday original content (FeedMe TV, Newsday Live, etc…)
7-Daily Delivery + Digital Access
for 8 weeks
$5.99/week thereafter Billed every 8 weeks
- The Newsday print edition, delivered daily
- Unlimited access to newsday.com
- Full access to all of our Newsday apps
- Access to our E-Edition newspaper
- Access to Newsday original content (FeedMe TV, Newsday Live, etc…)
Taco Map
Our favorite taco spots on Long Island
The taco landscape in the United States in both finely tuned and fiercely competitive. Taco styles range from authentically Mexican (topped with cilantro, minced white onion and a wedge of lime) to American (showered with shredded lettuce, grated cheese and pico de gallo) to Tex-Mex (stuffed to the gills.) And being surrounded by water means that our fish tacos are among the best on the East Coast. Here’s our cull of some of the Island’s best places to land some superlative tacos. Illustration by Neville Harvey

Avo Taco
Order at counter or kiosk in the hacienda-like dining room. The vegetarian tacos, including one with mushrooms and crispy onions, are standouts.
2340 Jericho Tpke., New Hyde Park
516-373-2340 https://www.avotaco.com/Copper & Clay
This spot is known for its al pastor (spit-roasted pork), but tacos filled with grilled local monk fish or octopus and avocado may be among the daily specials. All come on house-pressed tortillas.
6 W. Park Ave, Long Beach
516-992-0628Dirty Taco & Tequila
This spiffy spot has a roster of 15 tacos (including one filled with Korean-style short ribs) as well as an equal number of tequilas.
3261 Merrick Rd., Wantagh
516-785-5300 http://dirtytacoandtequila.com/El Mercadito
Two doors to the left of El Mercadito bakery and deli is this sister taqueria. The simply topped tacos are dense with flavor and heat.
519 Union Ave., Westbury
516-338-6346El Paso Taco Grill
Among the tacos, all templated by the owner’s 60-something mother, the garlicky shrimp taco is a star.
787 Conklin St., Farmingdale
516-752-1872 https://elpasotacogrill.com/Little Mexico
The tortilla chips are fresh, the salsa has a kick. Try taco campechanos (stuffed with steak, chorizo and guacamole).
280 Post Ave, Westbury
516- 333-2038 http://littlemexicorestaurantbar.com/Nacho Mama’s
In 2019, this food truck went brick and mortar, but the owner still uses a wood fire to cook the taco fillings.
7 West Village Green, Hicksville
516-596-5182Nelly’s Taqueria
The tacos here are based on family recipes from Matamoros, Mexico. (Other location: 47 Boundary Ave., Farmingdale)
356 W. Old Country Rd., Hicksville
516-261-9177 https://nellystaqueria.com/Piñata’s Mexican Grill
Among the winning soft-corn tacos are spicy chorizo, succulent tongue (lengua) and authentic fish tacos. (Other location: 450 Sunrise Hwy., Massapequa Park)
601 Hicksville Rd., Bethpage
516-502-0399 https://www.pinatasmexicangrill.com/Rock A Taco
There are dual taco styles at this 20-seat taqueria: “street cart” tacos garnished with cilantro, onion and lime, and more elaborate “rock’n” tacos.
280 Merrick Rd., Rockville Centre
516-992-0477Taco King Mexican Grill
Carnivores go for grilled skirt steak tacos— and vegans, steamed vegetables with beans. Tortillas made in house.
480 Hempstead Tpke., W. Hempstead
http://tacokingonline.com/Del Fuego
This is as close to a Tex-Mex institution as can be (at least in Suffolk County), with a lively bar scene and tacos of many stripes. (Other locations: Babylon, East Northport, Patchogue.)
430 N. Country Rd., St. James
631-963-6900 http://www.delfuegorestaurant.com/JR El Rodeo
This bare-bones storefront has made-to-order tacos, including tacos dorados, four deep-fried cheese tacos with lettuce and sour cream.
130 Montauk Hwy., East Moriches
631-909-2666 http://www.elrodeony.com/Lucharitos Taqueria & Tequila Bar
Tacos are best ordered traditional style, on soft 21 corn tortillas topped with salsa verde, pickled radish, chopped onion and cilantro. (Other location: 487 Main Rd., Bldg. D, Aquebogue)
119 Main St., Greenport
631-477-6666 https://www.lucharitos.com/Mamey Mexican Taqueria
This tidy spot near the LIRR station turns out excellent al pastor and carne asada tacos. Don’t miss the hibiscus drink called Jamaica.
122 N. Carll Ave. Babylon
631-539-9144 https://www.mameybabylon.com/Mattitaco
At this whimsical new-wave taqueria, the Culinary Institute of America–trained chef serves tacos on organic corn tortillas. A sure bet is the Hawaiian, filled with pork that’s been stewed in orange juice and Coca-Cola.
10560 Main Rd., Mattituck
631-298-7826 https://www.mattitaco.com/Mexican Grill 2000
Both the chef and owner hail from Puebla, Mexico; the fish tacos, filled with fried flounder, have many local devotees.
703 Medford Ave., Patchogue
631-607- 6554 http://litrade.net/mexicangrill/Swell Taco
Counter service may be in a back alley, but lines often form for their American-style tacos. (Other location: 30 E. Main St., Patchogue)
135 Deer Park Ave., Babylon
631-482-1299 https://www.swelltacoli.com/Taco Bout It
The tacos at this hidden gem are cooked by an Oaxacan chef and include shrimp, al pastor, chorizo, fish and roasted veggies. Cash only.
40B E. Main St., Riverhead
631-574-8787 https://www.tacoboutitny.com/Taqueria Mexico
The al pastor taco is addictive at this 15-year-old spot. Owner Rolando Mancilla, a Toluca, Mexico, native, also owns nearby Taqueria Cielito Lindo.
709 E. Main St., Riverhead
631-208-2902Tocolo Cantina
This modern spot serves California-style tacos, including a cochinita made with Berkshire pork, pickled onion, and salsa borracha.
920 Old Country Rd., Garden City
516-222-0060 https://www.tocolocantina.com/Verde Kitchen & Cocktails
The inventive lineup at this hip, handsome restaurant includes charred octopus. The bar turns out first-class margaritas, too.
70 E. Main St., Bay Shore
631-665-6300 https://www.verdekitchen.com/Taqueria Mexico Lindo
This taqueria-market is about as authentic as it gets; tacos are traditionally dressed with cilantro, lime wedges and onion.
1429 New York Ave., Huntington Station
631-423-5980La Fondita
This popular East End vortex offers takeout and some outdoor seating overlooking a pond. Three terrific tacos: carne asada, chorizo, pescado (fish).
74 Montauk Hwy., Amagansett
631-2267-8800 https://www.lafondita.net/