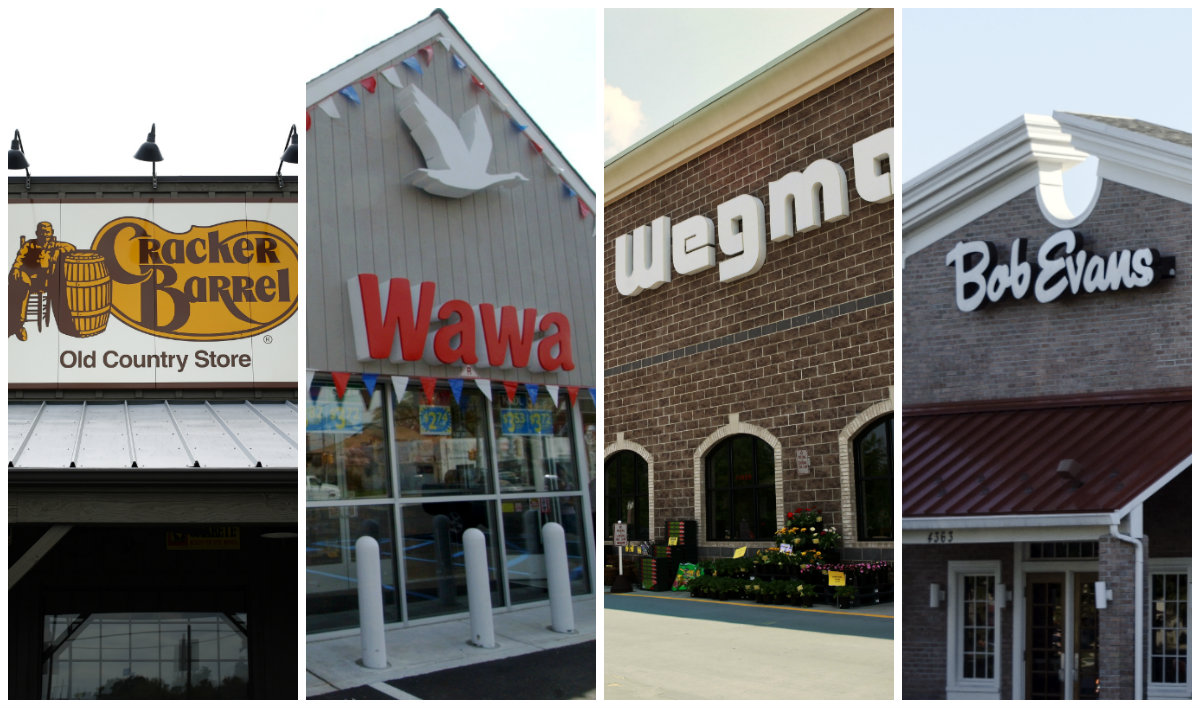
Some of the nation’s largest and popular retailers have avoided coming to Long Island because of its competitive marketplace, expensive real estate and administrative red tape.
Two big names in the mid-Atlantic region, grocery giant Wegmans and convenience chain Wawa, have yet to put roots on the Island, even though they are expanding nearby.
Rochester, New York-based Wegmans, which was the only grocery chain to earn an “excellent” grade from Consumer Reports readers in a May survey, plans to open its first New York City store, in Brooklyn in 2019.
Philadelphia-based Wawa, which already is in New Jersey and Pennsylvania, is expanding in both states.
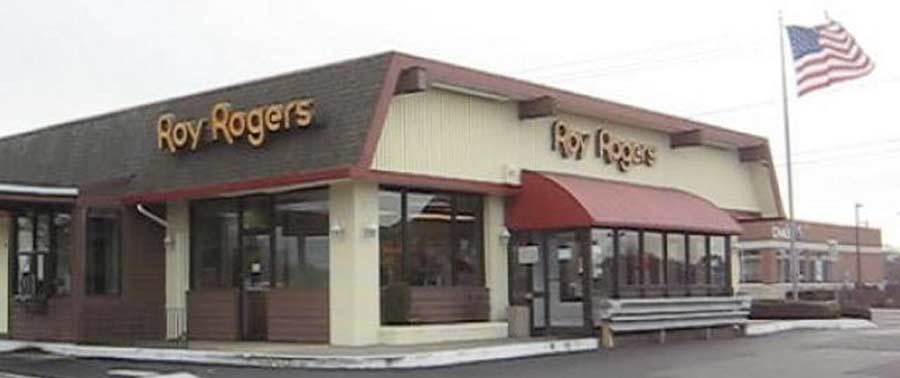
Roy Rogers, the Frederick, Maryland, restaurant chain that left Long Island in 2010, said it is in discussions to get back into the market, although it doesn’t have a timetable for its return.
The Cracker Barrel restaurant group, of Lebanon, Tennessee, O’Reilly Auto Parts, of Springfield, Missouri, Bob Evans Restaurants, Dollar General, Ross Dress For Less and Waffle House are among the national chains not on Long Island.
The long process of getting government zoning approvals discourages some retailers from expanding here, said David F. Chinitz, president and CEO at Park Place Realty Group in Melville.
“It could take less than 45 days to get something approved elsewhere, but that same process could take two years or more here,” Chinitz said.
Nevertheless, Long Island’s higher-than-average median household income and dense population outweigh its drawbacks for many other chains.
“Disposable income generally offsets the extra costs, which is why most of the retailers are here,” Chinitz said.
Thirty nine of the 50 largest retailers by 2016 sales, according to the National Retail Federation, have locations on Long Island. Of the 11 that aren’t here, all but three are regional grocery stores.
The median household income in Nassau County rose more than 3 percent to $105,870 in 2016, up from $102,403, according to recently released U.S. Census Bureau data. Suffolk County’s median household income rose 4 percent to $92,933, from $89,488 in 2015.
Those figures compare with a national median household income of $59,039 in 2016.
Stew Leonard’s has recently opened two Long Island stores, overcoming challenges that new chains face.
The supermarket originally tried to open on Long Island in 2002 at Route 110 and Conklin Street near Republic Airport in East Farmingdale. The plans fell through after objections by local aviation officials, pilots and the state Department of Transportation, which said the location would put shoppers too close to the airport’s main flight path.
But when the Dave & Buster’s restaurant pulled out of Airport Plaza, Stew Leonard’s took that space for its first Long Island supermarket, in January 2016. It opened a second store, in East Meadow, in August.
“We knew we wanted to be on Long Island,” said Stew Leonard Jr., president and chief executive of the family-owned company.
“For our stores, at our size, to be supported properly, we need to have a pretty good population in the area,” Leonard added. “The Long Island market works because of that. Also, we’ve learned that Long Island is full of foodies.”
Online competition poses a challenge for retail expansion, said Herman A. Berliner, an economist and dean of the Frank G. Zarb School of Business at Hofstra University in Hempstead.
“But when you look at the overall numbers, we have an amazingly low vacancy rate here, especially among our largest and economically most significant malls,” Berliner said.
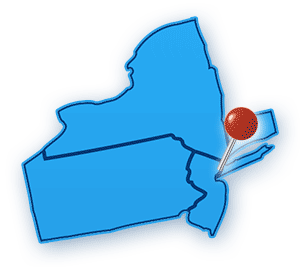
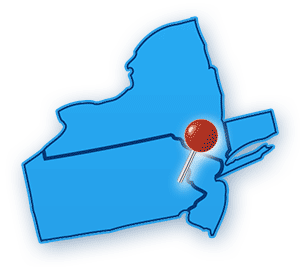
Below are nine popular national and regional chains that are near Long Island, but are not here.
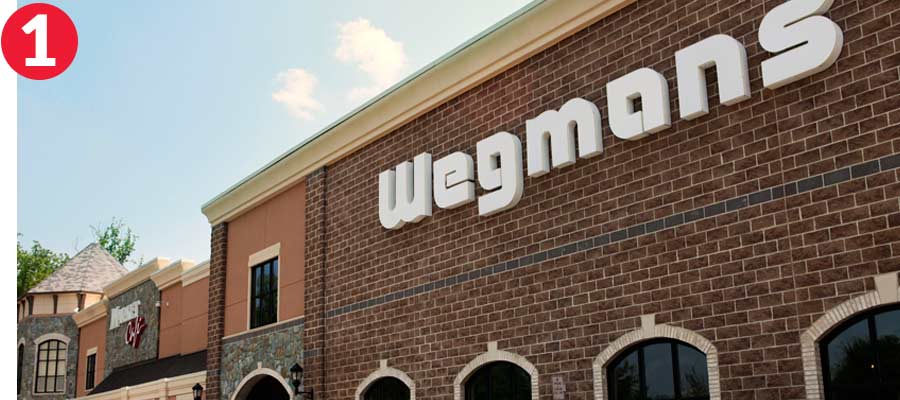
Wegmans
HEADQUARTERS: Rochester, New York
NUMBER OF STORES: 94

CLOSEST STORE: Brooklyn — coming in 2019
Long Island residents who have traveled or lived upstate or in New Jersey might have visited Wegmans grocery stores, which are known for big displays of fresh produce and prepared foods, attentive customer service and well-maintained stores.
In 2016 more than 7,800 people nationally contacted Wegmans asking for a store in their community, the company said.
The family-owned regional market, which turned 100 years old last year, has expanded along the Eastern Seaboard. It has 46 stores in New York, 17 in Pennsylvania and nine in New Jersey, among other locations. On Sept. 24 the company opened its 94th store, in Montvale, New Jersey, said Jo Natale, the company’s vice president of media relations.
If Long Island had a Wegmans it would have everything I need
— Samantha Pompa (@sammpompaa) July 17, 2017
In 2019 it will open a location in the Brooklyn Navy Yard. But the chain says it has no plans to come to Long Island.
Each store typically employs 450 to 550 workers, Natale said. For 20 years the company has made Fortune magazine’s list of the 100 Best Companies to Work For. Wegmans ranked No. 2 this year. — Carrie Mason-Draffen
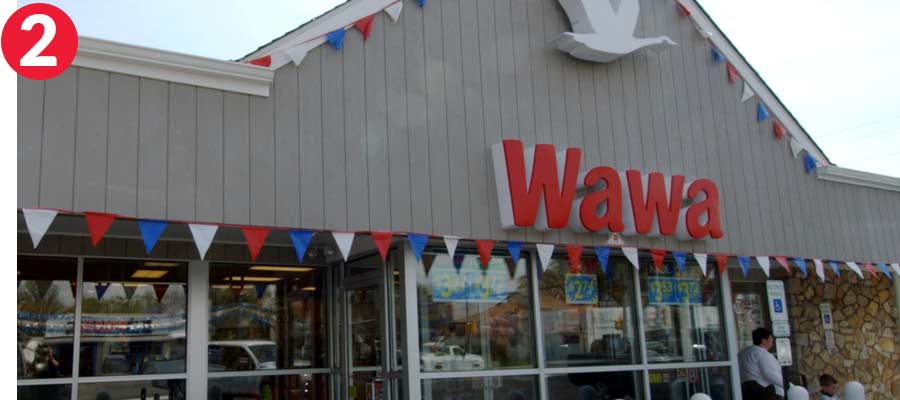
Wawa
HEADQUARTERS: Philadelphia
NUMBER OF STORES: 640

CLOSEST STORE: Hackensack, New Jersey
Thirty miles — and multiple bridges — separate Wawa in New Jersey from Long Island.
But those 30 miles aren’t expected to shrink anytime soon.
The convenience store brews about 195 million cups of coffee and serves 300 million customers each year. They also eat more than 60 million built-to-order hoagies — that’s Philadelphian for
hero or sub — annually. The stores are open 24 hours a day, 365 days a year.
Wawa stores offer some of the same products, and are generally the same size, as 7-Eleven stores.
That’s a problem for any competitor interested in the Long Island market, retail experts said.
Whenever I tell people we don't have Wawa's on Long Island they look at me like I'm from a 3rd world country
— Allan Pedersen (@APedersen0252) September 23, 2017
“7-Eleven is everywhere, and they’re very, very powerful,” said Howard Davidowitz, chairman of Davidowitz & Associates Inc., a retail consulting and investment bank based in Manhattan. “People love their coffee and special drinks and are loyal.”
Wawa declined to comment for this story. But it continues to expand elsewhere, including in Florida, where it plans to open 15 stores this fall. — David Reich-Hale
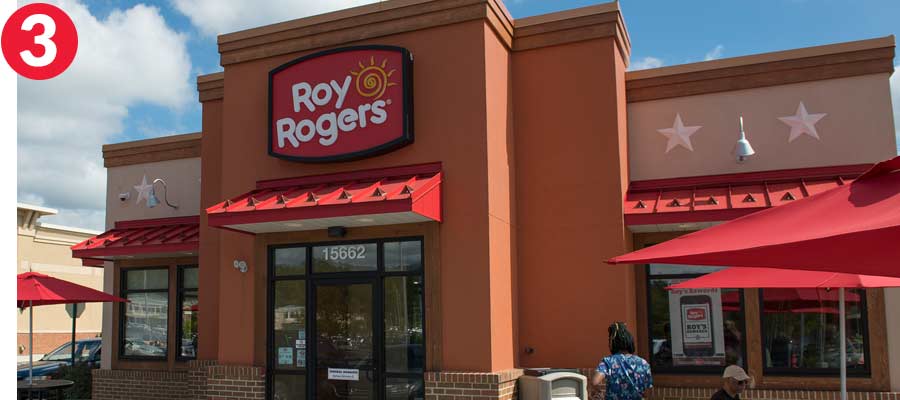
Roy Rogers
HEADQUARTERS: Frederick, Maryland
NUMBER OF STORES: 54

CLOSEST STORE: Edison, N.J.
Roy Rogers, known for roast beef, fried chicken and hamburgers, was a fast-food mainstay in the Northeast in the 1980s. The chain had more than 600 U.S. locations in 1989.
But in 1990, Marriott Corp. sold the chain to Hardee’s Food Systems, and many Roy Rogers locations were converted into Hardee’s, McDonald’s, Boston Markets, Wendy’s or other brand stores.
By the mid-2000s, there were only about 40 Roy Rogers stores left, most of them located in the Washington, D.C., suburbs and along the New York State Thruway and New Jersey Turnpike.
As in an old western movie, however, Roy Rogers is making a comeback, expanding to more than 50 restaurants. The chain has built up its business in New Jersey and the Washington metro area.
Roy Rogers closed its last Long Island location, in Shirley, in 2010, but is planning a return.
Roy Rogers left Long Island in 2010. The chain hopes to return soon https://t.co/QVsha9y9QB
— David Reich-Hale (@drhli) October 12, 2016
“Probably the biggest obstacle, as in many markets, has been in finding the right location,” said Jim Plamondon, co-president of Roy Rogers Franchise Co. “We are pursuing that goal and are currently in advanced discussions with a prospective new franchisee.” — Ted Starkey
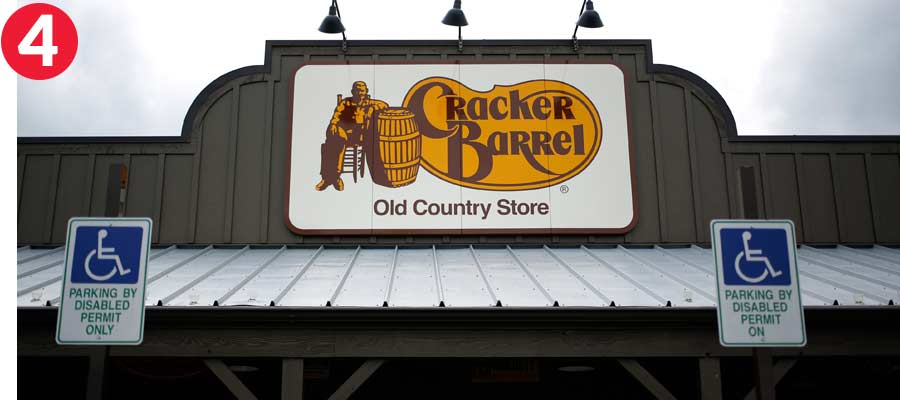
Cracker Barrel
HEADQUARTERS: Lebanon, Tennessee
NUMBER OF STORES: 645
CLOSEST STORE: Milford, Connecticut
If you’ve driven America’s highways, chances are you’ve passed a Cracker Barrel.
The restaurant features Southern cuisine such as Momma’s Pancake Breakfast and Chicken n’ Dumplins.
The chain’s locations each have a porch with rocking chairs and are decorated with about 1,000 Americana artifacts.
Most stores also feature an old-time general store, where the chain sells about 83,000 rockers, 3.4 million pieces of women’s apparel and 14 million thin-stick candies per year, the company said.
Its first location opened in Lebanon, Tennessee, in 1969. Expansion in the 1990s and early 2000s brought it nationwide. About 40 percent of its 217 million annual guests are highway travelers.
“They associate themselves with highways,” said Thomas Shinick, an adjunct professor of marketing and management at Adelphi University in Garden City. “That’s not conducive to what we have on Long Island.”
Hello – We will let our Real Estate Team know that you would like to request a Cracker Barrel location on Long Island.
— Cracker Barrel (@CrackerBarrel) July 13, 2017
Construction of a Cracker Barrel Old Country Store on Long Island has long been rumored. Now, two national construction companies, both of whom have built scores of Cracker Barrels over the years, have requested bids from local subcontractors for work on a new restaurant on Crooked Hill Road in Commack.
The last time rumors of an impending Cracker Barrel bubbled up on Long Island was in 2015, and social media lit up like a house afire. Soon, the company duly issued a denial. This time, Cracker Barrel isn’t confirming or dismissing the idea. — Ted Starkey and Erica Marcus
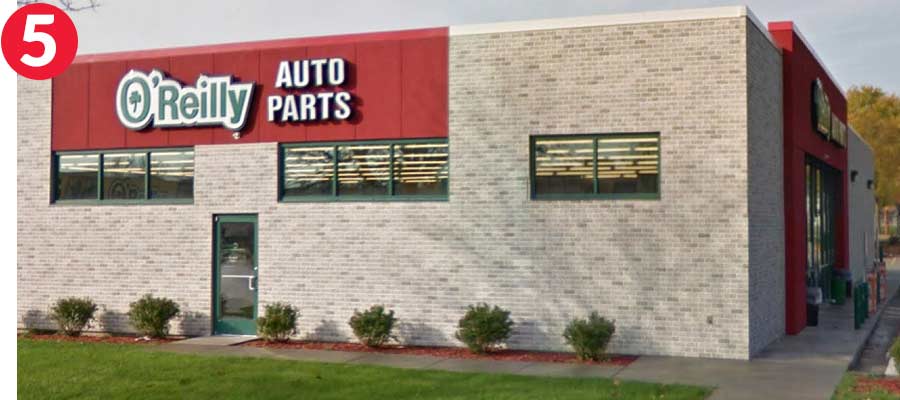
O’Reilly Auto Parts
HEADQUARTERS: Springfield, Missouri
NUMBER OF STORES: 4,934
CLOSEST STORE: West Haven, Connecticut
O’Reilly Auto Parts opened in the mid-1950s, during America’s postwar expansion into the suburbs. By 1975, O’Reilly had grown to $7 million in sales at nine stores in southwest Missouri.
The company grew more rapidly after it went public in 1993, and it now has stores in 47 states.
On Long Island, competitors such as Advance Auto Parts, Napa Auto Parts and AutoZone are already established. “There is quite a saturation of auto parts stores on Long Island,” Shinick said.
An O’Reilly executive said competition has never kept it from expanding.
“We have not been first to market, almost ever,” said Mark Merz, vice president of investor relations, financial reporting and planning at O’Reilly. “We just haven’t gotten to Long Island yet.”
Shinick said that if O’Reilly came to Long Island, it would face an additional challenge because the percentage of leased cars — 62.7 percent of new car acquisitions, according to consulting company IHS Market — is about twice the national average.
“The cars here are newer, and they [rarely] break down,” he said, and are under warranty when they do. — David Reich-Hale
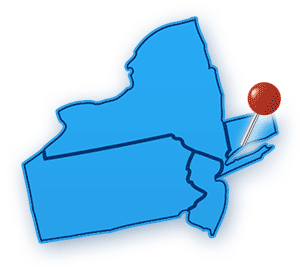
Bob Evans Restaurants
HEADQUARTERS: New Albany, Ohio
LOCATIONS: 523
CLOSEST TO LONG ISLAND: Bensalem, Pennsylvania
Bob Evans was a farmer and businessman in southeastern Ohio who started his food career by making sausage for his diner in 1948. He opened his first Bob Evans branded restaurant in Rio Grande, Ohio, in 1962. The company opened its 100th restaurant in 1983 and now has more than 500 locations in 18 states. Most are in the Midwest, mid-Atlantic and South.
The privately owned chain pitches hospitality and food quality — the Bob Evans name is in the sausage display of many supermarkets — and its restaurants have all-day breakfasts and a country-living theme.
I'd move out of Long Island for reasons:
— Patriece Ausili (@patrieceausili) November 3, 2013
1. Cracker Barrel
2. Bob Evans
3. Wawa
4. Cheaper gas
Bob Evans branched out in 2004 when it purchased California-based Mimi’s Café chain, a French-themed eatery. The company sold the 145-location chain in 2013 for $50 million, less than half of the original $103.3 million it paid for it.
Following the sale, the company went back to focusing on Bob Evans expansion. The company wouldn’t comment on growth plans. — Ted Starkey
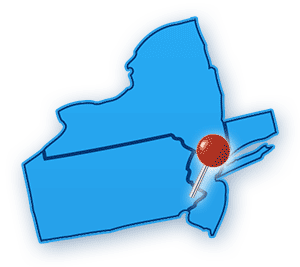
Dollar General
HEADQUARTERS: Goodlettsville, Tennessee
LOCATIONS: 14,000
CLOSEST TO LONG ISLAND: Bronx
Discount chain Dollar General, which bills itself as “America’s neighborhood general store,” was the 20th-largest chain in the country in 2016, with more than $20 billion in sales, according to the National Retail Federation. It is the largest retailer without a Long Island presence that isn’t a regional grocery store.
The first Dollar General store opened in in 1955 in Springfield, Kentucky, where no item sold for more than $1.
By 1989 the chain had 1,300 stores in 23 states. Most products cost $10 or less.
@Pringles I want to try your Ramen-flavored Pringles but there aren't any Dollar General stores on all of Long Island! Please help!
— Luigi (@LuigiM227) July 7, 2017
The company opened its 14,000th location in August. It now has stores in 44 states.
Despite the chain’s reach, none are on Long Island. The company didn’t respond to questions about its expansion plan. — Ted Starkey
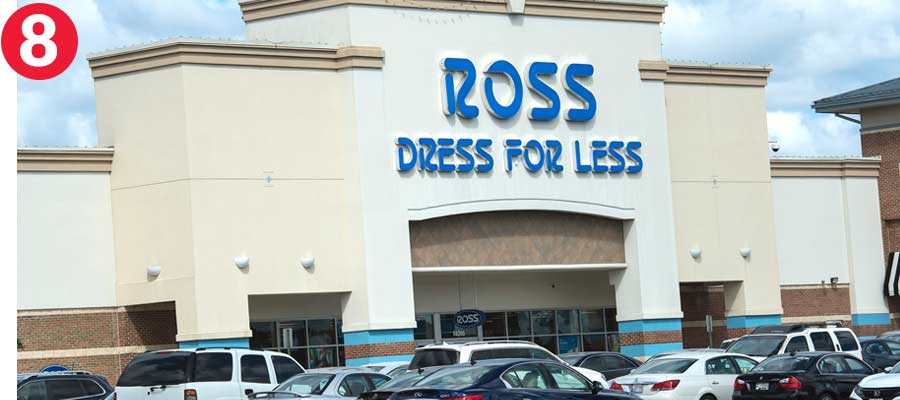
Ross Dress For Less
HEADQUARTERS: Pleasanton, California
LOCATIONS: 1,340

CLOSEST TO LONG ISLAND: East Windsor, New Jersey
The company launched in 1982 when six junior department stores in the San Francisco area converted into Ross Dress for Less. It is known as an off-price apparel and home fashion retailer.
Along with 1,340 locations in 36 states as of last year, the company also operates 193 dd’s Discounts locations. Ross launched those in 2004.
The store expanded eastward from its California roots and eventually moved into the mid-Atlantic during the 2000s.
The company said on its corporate website that it has a goal of reaching 1,500 to 2,000 stores nationwide, but it didn’t specify where the expansion would be. The closest Ross Dress for Less location to Long Island is in central New Jersey. The company didn’t comment on its expansion plans.
Last year Ross ranked 35th in the United States among retailers, with $12 billion in sales, according to the National Retail Federation.
Ross is the second-largest discount clothing retailer in the country, behind only TJX Cos., which owns TJ Maxx and Marshall’s. — Ted Starkey
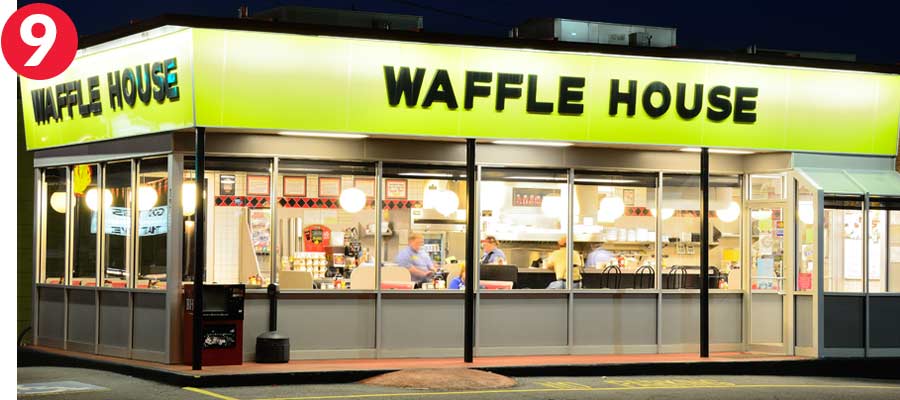
Waffle House
HEADQUARTERS: Norcross, Georgia
LOCATIONS: 1,500+
CLOSEST TO LONG ISLAND: Bethlehem, Pennsylvania
Waffle House opened its first restaurant on Labor Day weekend in 1955 in suburban Atlanta. It has grown into a Southern staple along interstates and towns.
The brand is known for its distinctive yellow signs, friendly service and inexpensive food that is available 24 hours a day, 365 days a year. Most locations feature a jukebox that patrons can use to play Waffle House-branded songs such as “Waffle House for You and Me.”
Upset that we don't have Waffle House on Long Island. Because it's wonderful.
— Jesse (@Alotta_Pain) September 20, 2017
The brand is so ubiquitous in the region — and so well run —that FEMA has a “Waffle House Index,” which shows whether the company’s restaurants are functioning after a natural disaster such as a hurricane.
The company serves an average of 145 waffles per minute.
While there are no Waffle House locations in New York State, there are two roughly 100 miles west of the Island in the industrial Pennsylvania cities of Allentown and Bethlehem. — Ted Starkey