
Long Island weather history gets a shock with new records
Long Island’s weather history got a shot in the arm when 20 more years of daily data were recently added to the area’s official records.
Weather data for Long Island MacArthur Airport now goes back nearly 54 years to September 1963.
This means that some previous records, such as for highest or lowest temperatures, have been displaced, as well as the reconfiguring of some the “top 10” lists for weather extremes.
Here’s a look at some of the new dates that have cracked the Long Island weather charts.
New hottest day:
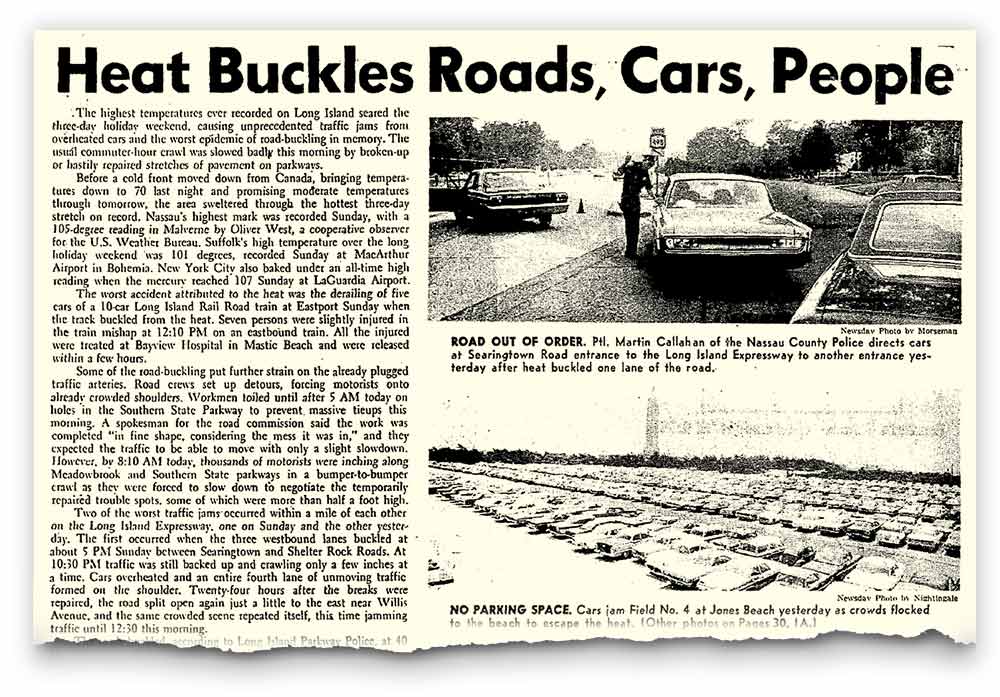
July 3, 1966: The temperature hit 104 degrees on this day, booting out July 5, 1999, previously considered Long Island’s hottest day at 102 degrees.
The record-breaking temperatures caused five cars of a Long Island Rail Road train to derail at Eastport, when the track “buckled,” according to a Newsday article.
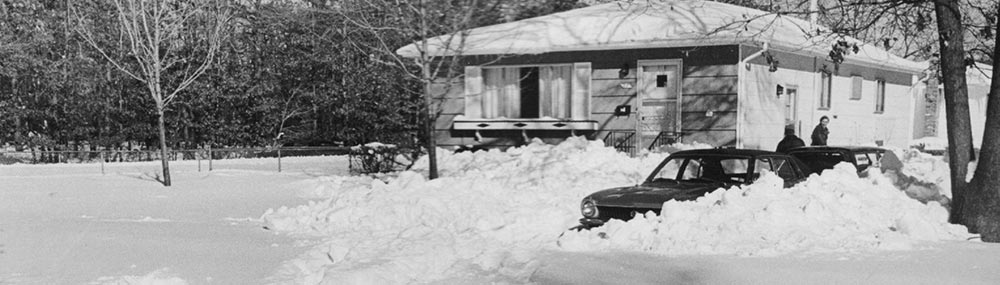
That July 4 holiday weekend was part of Long Island’s hottest 3-day stretch on record at the time, resulting in “unprecedented traffic jams from overheated cars and the worst case of road-buckling in memory,” a July 5, 1966 Newsday article said.
New coldest day:
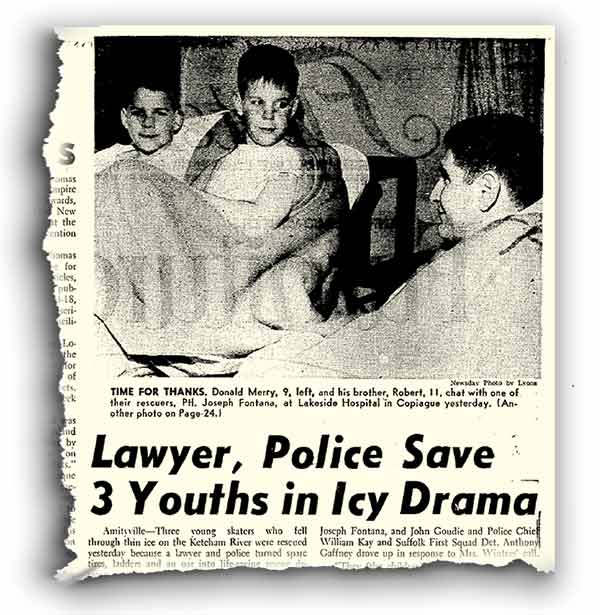
Feb. 13, 1967: Long Island experienced a frigid minus 14 degrees on this day. The new weather data also replaced the second-coldest day, which is now Jan. 18, 1965, when the temperature fell to minus 8 degrees. Before that, the record was minus 7 degrees on Jan. 22, 1984 and Jan. 15, 1988.
On this record-setting day, Newsday also reported on a heroic rescue. Three young skaters fell through thin ice on the Ketcham River and were rescued by a lawyer and police officers who turned spare tires, ladders and an oar into life-saving rescue devices, Newsday reported. The three children were transported to a nearby hospital.
Coldest month
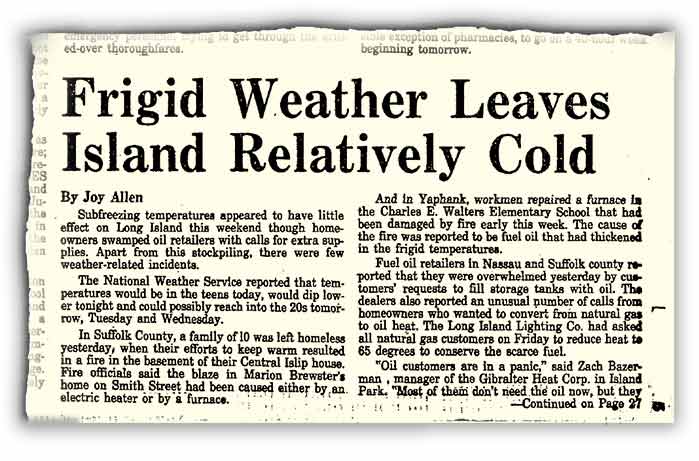
January 1977: This month saw an average monthly temperature of just 20.8 degrees, displacing the previous record of February 2015, which had an average temperature of 21.6 degrees.
The frigid temperatures at the start of 1977 overwhelmed heating-oil retailers with orders, according to Newsday articles that month. Oil dealers also reported an unusual number of calls from homeowners who wanted to convert to natural gas. And the Long Island Lighting Co. was advising natural gas customers to keep the heat at 65 to conserve the scarce fuel.
A warmer, wetter Long Island
While the added data from MacArthur breaks some daily records, overall it also falls in line with a trend toward warmer, wetter conditions in the region.
Despite a slew of new record-setting days and months, overall, there were still more records set for heat and rain in the past 25 years than the years prior to that.
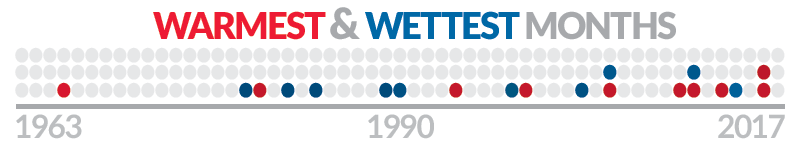
Here are the top 10 dates for warmest and wettest months. Dates that were part of the newly added 1963-1983 data set are in bold:
WARMEST MONTHS
- July 1999
- July 2013
- July 2010
- July 2011
- August 1980
- August 2016
- July 1994
- August 2005
- July 2016
- July 1966
WETTEST MONTHS
- August 2014
- October 2005
- August 1990
- August 2011
- June 2003
- June 1998
- January 1979
- May 1989
- June 1982
- May 1984
A chilly history
However, MacArthur’s revised top 10 list for the coldest temperatures skew toward the earlier years — the ’60s through the early ’80s. The list of snowiest months also includes a good representation from that time frame.
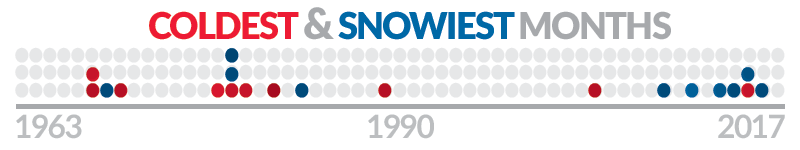
COLDEST MONTHS
- January 1977
- February 2015
- February 1979
- February 1978
- January 1970
- January 2004
- January 1968
- December 1989
- January 1981
- February 1968
SNOWIEST MONTHS
- January 2011
- February 2013
- January 2015
- February 1969
- February 1978
- January 1978
- February 1983
- December 2009
- January 2014
- January 2016
Read more about Long Island’s weather history here.
Research: Newsday library, Northeast Regional Climate Center