
How Long Island voted for Trump compared to the country
President-elect Donald Trump may not have won New York state but he got 48.6 percent of the votes on Long Island, including a majority in Suffolk County, where Barack Obama won in 2012 and 2008.
Trump won
Suffolk with
of the vote
He fell shy in Nassau but garnered
45.9%of the vote
Looking at the number of votes cast for Trump in counties across the country, Suffolk comes in ninth place with 328,403 votes, and Nassau comes in eleventh place, with 275,479 votes for Trump.
Who else voted like us?
Twenty counties around the country voted similarly to Long Island’s two counties, within a 1% margin. On average, these counties are smaller, poorer and less educated, according to the U.S. Census Bureau.
Of those 20, let’s look at those most closely matched to Nassau and Suffolk’s numbers.
Like Nassau County, all of these are counties that voted democrat but gave Trump between 45.9 and 46% of its vote. Unlike Nassau, these are counties that voted democrat in states that went republican. Compared to Nassau:
Lehigh County, PA
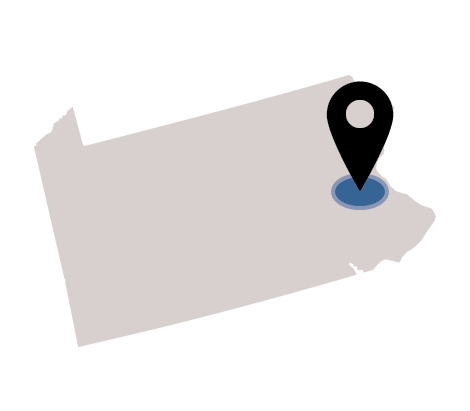
- has 26% of Nassau’s population
- the median income is $55,681 to Nassau’s $98,401
- and 28.1% of its adult population has bachelor’s degrees or higher compared to 42.3% in Nassau.
- The county seat is Allentown. It is one of the fastest growing counties in Pennsylvania. The largest employers are hospitals and the food service industry.
Frio County, TX

- has 1.3% of Nassau’s population
- the median income is $35,681 to Nassau’s $98,401
- and 7.9% of its adult population has a bachelor’s degrees or higher.
- Frio County is named for the river that runs northwest to southeast through the county. The county seat is Pearsall, which is about 55 miles from San Antonio and about 100 miles from the Mexican border.
Kleberg County, TX

- has 2.3% of Nassau’s population
- the median income is $37,725 to Nassau’s $98,401
- and 15.2% of its adult population has a bachelor’s degree or higher.
- The county seat is Kingsville, which is about 44 miles from Corpus Christi. Most of the county’s land lies in King Ranch, which is home to 35,000 cattle.
Like Suffolk County, each of the following are counties that voted between 52.4 and 52.5% for Trump, and two of these counties are in swing states. Compared to Suffolk:
Grand County, CO

- has 1.2% of Suffolk’s population
- the median income is $64,109 to Suffolk’s $88,323
- and 36.3% of its adult population has a bachelor’s degree or higher compared to 33.5% in Suffolk.
- Grand County is home to eight nationally protected parks or wilderness areas, Colorado’s largest natural lake and the headwaters of the Colorado River. It is about 70 miles from Denver.
Clay County, MO
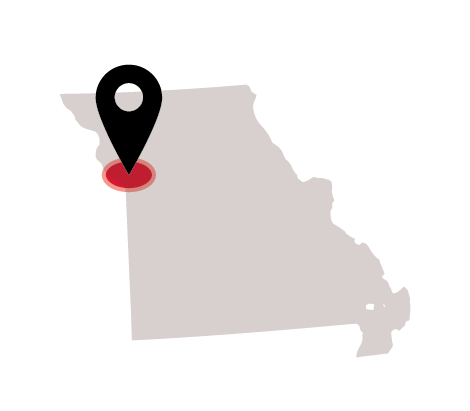
- has 15.2% of Suffolk’s population
- the median income is $61,184 to Suffolk’s $88,323
- and 30.7% of its adult population has a bachelor’s degree or higher.
- Clay County is the fifth most populous county is Missouri. The county seat is Liberty, which is about 15 miles from Kansas City. The Ford Motor Company is a major employer.
St. Lawrence County, NY
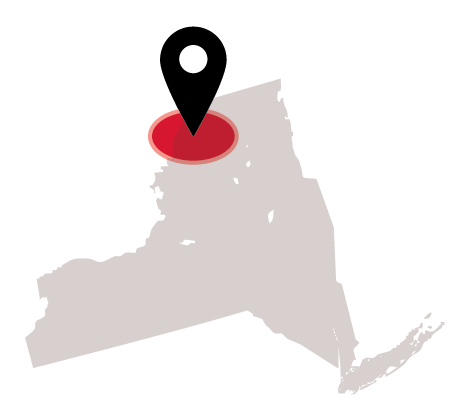
- has 7.5% of Suffolk’s population
- the median income is $44,454 to Suffolk’s $88,323
- and 21.6% of its adult population has a bachelor’s degree or higher.
- St. Lawrence is New York’s largest county by area. It offers access to the St. Lawrence River and the Adirondack Mountains. It is home to two state universities, SUNY Potsdam and SUNY Camden.
Here are the rest of the 20.
Waldo County, ME
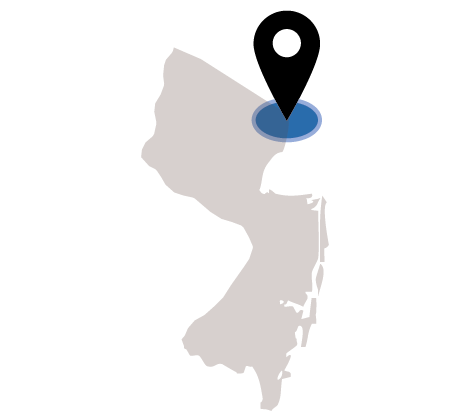
Cumberland County, NJ
Yazoo County, MS
Norman County, MN
Staunton City, VA
Scott County, IA
Merrimack County, NH
Rockland County, NY
Lenoir County, NC
Woodruff County, AR
Carson City, NV
Placer County, CA
Lowndes County, CA
Erie County, OH
Overall, these counties are not very diverse. Whites who are also not Hispanic make up the majority, with the exception of Frio and Kleberg, which are at least 65 percent Hispanic or Latino. More than half the counties had the rate of minorities at 20 percent or lower. Nassau had the eighth largest minority population among the 20 counties that voted similarly.
How did similar counties vote?
There are six counties often associated with Long Island because they are suburban, of similar median income, relatively close population size – Long Island is unusually populous – and are in close proximity to a major metropolitan area.
Bergen County, NJ
Population: 925,328
Income: $83,686
Fairfax County, VA
Population: 1,142,232
Income $112,102
Fairfield County, CT
Population: 939,904
Income $83,163
Middlesex County, NJ
Population: 828,919
Income $83,488

Population: 1,030,447
Income $79,926
Population: 968,802
Income $83,422
Trump did not win in any of these counties. Of these similar counties, Suffolk and even Nassau voted for Trump in higher percentages.
Compare the percentage of Trump votes among counties with similar economic characteristics.
Comparing counties of similar population sizes to Long Island results in a list of places not very much like Long Island – Nassau and Suffolk counties each have the population size of cities like Manhattan and Philadelphia. However, of the 20 counties within 20% population size of Nassau and Suffolk counties, none voted for Trump in as high margins as the counties on Long Island.
All of these counties voted democrat in 2012, except for Salt Lake. All of them voted democrat in 2016, except for Suffolk.
Counties within 20% population size of Nassau, Suffolk and how they voted for Trump:
Produced by Erin Geismar