
Education trends: Long Island vs. New York State

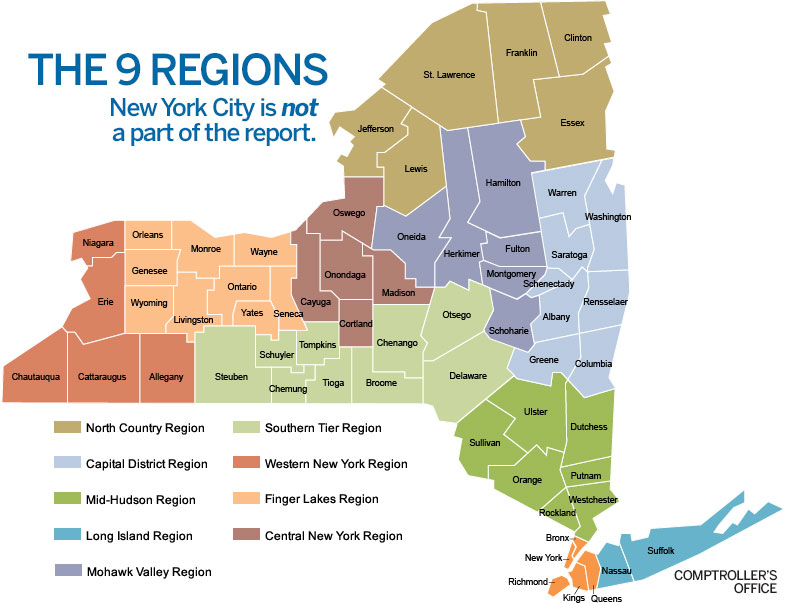
Comptroller Thomas DiNapoli’s report on statistics and trends in New York school systems offers a look at how Long Island schools stack up against eight peer regions around the state.
“By examining regional comparisons and trends in school district revenues, expenditures and student demographics, we can better inform the decisions of state lawmakers, education stakeholders and taxpayers,” DiNapoli said.
In general, the report shows that Long Island relies most on property taxes, spends more per pupil, graduates the highest percentage of students, ranks highest for proportion of students with limited English proficiency, and ranks lowest for reports of violent incidents and possession of weapons.
Here’s a look at how Long Island compares with the eight other regions in New York state, excluding New York City, for the 2014-2015 school year.
Property tax revenues
Total state school district revenues in 2014-15 were $37.7 billion; the funds come from federal and state aid, STAR revenues, and local revenue in the form of property taxes, all of which vary by region. Long Island leads the state in percent of total school revenue that comes from property taxes.
 68%
68%
Of Long Island’s $11.7B in school revenues come from property taxes, the most in the state
 54.5%
54.5%
Statewide average
 32.2%
32.2%
Of school revenues in “North Country” come from property taxes, the lowest in the state
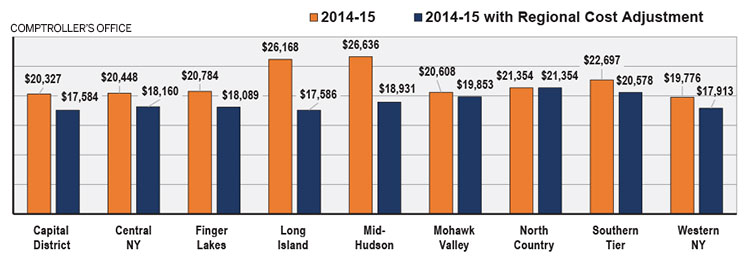
Per-pupil spending
The Long Island, Mid-Hudson Valley and Capital District regions tend to be the wealthier areas statewide, based on both property and income wealth per pupil, the report said. Statewide, the median school district expenditure per pupil in 2014-15 was $22,658. The report also notes regional cost differences. With that adjustment taken into account, Long Island’s per-pupil spending is second lowest in the state.
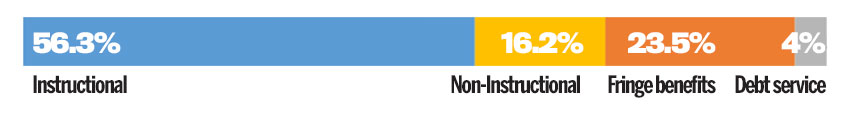
Where the money goes
Of Long Island’s $11.71 billion in total spending in 2014-15, a majority ($6.6 billion, or 56.3%) went toward instructional spending, slightly higher than the statewide average of 53.6%. Here’s a breakdown of LI’s total expenditures:
Topping the charts
According to DiNapoli’s office, Long Island led the nine regions in:

Highest graduation rate, 90%, and lowest dropout rate, 1.2%

Graduates who plan to attend a four-year college, 60%

Most students with limited English proficiency, 7%

Fewest high-need students: 8.5% in poverty, 30% eligible for free lunch

School safety, 0.8 incidents per 1,000 students

Fewest buildings considered poor or unsatisfactory, 2%
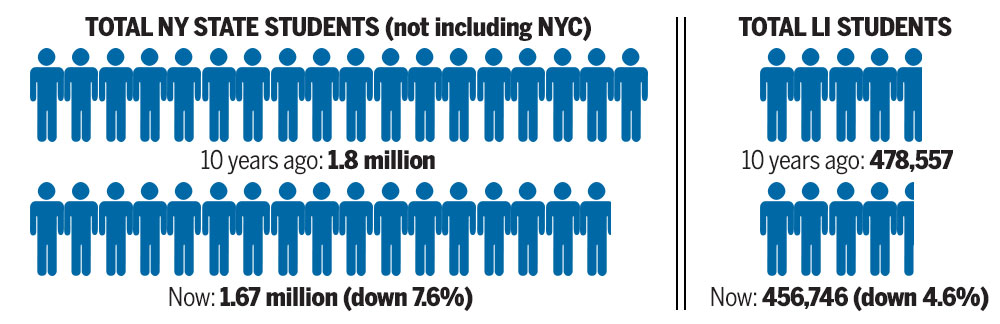
Dwindling numbers
Total enrollment in the nine regions has fallen since the previous study 10 years earlier, though total enrollment on Long Island has dropped at a less dramatic pace on Long Island.
Design and production by Newsday staff, Data from the Office of the New York State Comptroller